
By
Australian Broker talks to Martin North and Tim Lawless about whether there really is a housing recovery across Australia, what the latest property market data suggests about housing affordability, and how brokers should communicate this to their clients
HOUSING affordability and values often move in opposite directions and have done so particularly over the past decade when household income growth has been subdued and markets have moved through several cycles of both growth and decline, says CoreLogic
head of research Tim Lawless. However, CoreLogic’s national and capital city measure of housing values has been showing a strong rebound since June last year, with growth being led by Sydney and Melbourne but more recently rippling out to most of the broad regions around the country.
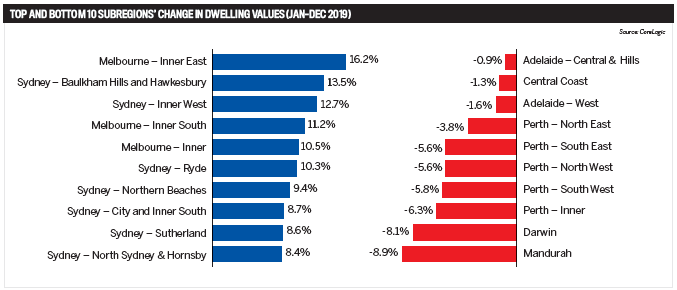
In fact, CoreLogic’s January results showed a broad-based rise in housing values, with every capital city and rest-of-state region recording a rise in values, apart from regional South
Australia, where values were flat. The CoreLogic national home value index was up by 0.9% over January, bringing the annual growth rate to 4.1% – the fastest pace of growth for a 12-month period since December 2017. According to Lawless, this demonstrates a broader recovery trend, which originally began in Sydney and Melbourne midway through 2019 and gradually spread to other areas.
Lawless says, “Housing values in Melbourne are only 1.2% away from staging a nominal recovery at the end of January, and Sydney values were 5.4% below their 2017 peak. Perth housing values look to be stabilising after posting a 21.6% decline in values between mid-2014 and late 2019, while Darwin values remain 31.8% below their 2014 peak.”
Housing recovery: Is it real?
Successive cuts to interest rates between June and October last year, the easing of serviceability rules by APRA and the federal election outcome all combined to remove some uncertainty around taxation reform and create a sense of stability in housing; this could have been the catalyst for the recovery in housing values. “From an affordability perspective,
the recent decline in housing values together with a modest rise in household incomes saw housing affordability noticeably improve,” says Lawless.
Indeed, the ratio of dwelling values to household incomes across the combined capital cities improved from 7.57 in late 2017 to 6.75 in June 2019, with Sydney and Melbourne recording more substantial affordability improvements. Sydney’s ratio fell from 9.7 in 2017 to 8.2 in June 2019 before trending higher over the September quarter as housing values once again outpaced incomes, according to CoreLogic data. In Melbourne, the ratio fell from a recent peak of 8.4 to 7.2, but like in Sydney it is once again rising as housing values recover. In Hobart, however, housing affordability has worsened substantially due to a significant rise in housing values over the past five years, while cities like Perth and Darwin are showing relatively healthy
ratios of housing values to household incomes due to the substantial fall in home values since 2014. Lawless points out that getting a comprehensive view of housing market conditions involves more than just measuring movements in property values. This is why CoreLogic compiles a broad array of housing market analytics, he says.
“Apart from value movements and an ordability measures, CoreLogic is measuring virtually every aspect of housing market performance and the factors which affect the performance of the market,” he explains.
But Martin North, principal at Digital Finance Analytics, says the CoreLogic index is “a black box”, suggesting he fails to understand how “the daily index moves even on non-trading days like Christmas”.
He says, “REA and other index providers such as Domain also run indices which do not always agree with CoreLogic’s series. For example, a few months back REA was saying Sydney prices rose 0.5% when CoreLogic says 5% – big differences. My own analysis and conversations with valuers indicate that the local data is not always mirroring the CoreLogic series. Despite what they say, there are some questions which have yet to be addressed.”
Lawless however argues that CoreLogic methodologies are well documented and completely transparent.
He says, “Our hedonic index methodology is available in the methodological document hosted on the CoreLogic website. Conversely, we would challenge anyone to find a methodological document/summary/overview on DFA’s market observations. Not only is their household survey sampling dubious, their commentary on housing market performance appears to be completely anecdotal.”
He continues, “We have a broad range of indices, from simple median prices and median valuations through to stratified median series, repeat sales indices, a hedonic valuation index that is also available across value based quartiles and deciles.
“Each of these series supports a different use-case. For example, our median valuation data is used as the benchmark for affordability assessments (paired with median household income data), the stratified median series is useful for benchmarking against the ABS and Domain stratified median series and the repeat sales index focuses purely on the gain or loss between sales. Our hedonic index is our flagship measure because it is designed specifically to control compositional bias or capital injection.
“We collect more than 70% of property sales data directly from the industry prior to any provision from the Valuer general in each state. We invest more than $20 million each year on our data acquisition and maintenance which is actually more than hometrack makes in revenue every year.”

Housing affordability
Housing affordability is an issue according to North, because brokers and consumers should not rely on high-level averages for a particular city, and, say, assume that prices in Sydney went up 5% over the quarter, “because it’s not as simple as that”.
While Lawless says, “It’s true that more expensive properties are recording the highest capital gains in Sydney and Melbourne – we can see this clearly in our stratified hedonic and decile hedonic series – but its incorrect to say these results are skewing the broader capital city measurements. If we were publishing an average (mean) or median based series then this would have a skewing effect.
“The hedonic index is a portfolio valuation measure that explicitly controls for compositional change or bias in the market. It’s also important to note that our indices are available and published across smaller geographical boundaries that measure value changes across the sub-regions of each city – as an example, every SA4 region of Sydney has recorded a rise in dwelling values over the three months ending January and only the Central Coast has seen a decline in values over the past twelve months.”
North adds, “The other problem is that a lot of the media which is connected to the real estate industry, which is connected to the government, want to talk prices up because growing house prices is the only economic game in town.
“If you listen to the Reserve Bank and the Treasurer, they’re all saying we need to create a wealth e ect so that people spend more… and that’s good for the economy.”
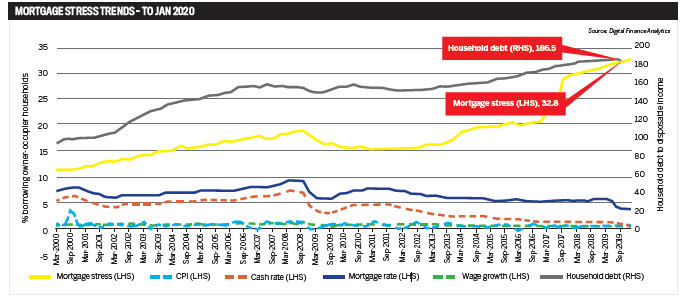
According to the latest analysis by Digital Finance Analytics as at the end of January this year, mortgage stress continues to push higher, with 32.8% of households now impacted, representing more than 1.1 million borrowing Australian households. In addition, it’s expected that defaults will be up to more than 83,400 over the next 12 months.
Such results are no surprise, given the ongoing pressure on incomes and rising costs despite somewhat lower mortgage rates for some borrowers, says North.
He explains, “The banks, of course, are deeply discounting rates for new loans, but many borrowers are unable to access these ‘cheap’ deals and are stranded on more expensive rates. Mortgage stress continues to be visible across most of our household segments, with more than half (56%) of young growing families exposed, including a number of recent first-time buyers.
“Those in the urban fringe, especially on new estates, are also exposed (50%), but the largest cohort is in the disadvantaged fringe, where incomes are below average as well. More than 300,000 households in this group are exposed, comprising 47.2% of all households in this segment.”
While Lawless says he expects housing values to continue rising, he admits they might not rise at the same rapid pace that was witnessed over the second half of last year.
He says, “Our data is showing that housing values are still trending higher, but the rate of growth has been slowing since moving through a peak late last year.”
He suggests the main factors contributing to the slowdown are worsening housing a ordability (especially in Sydney and Melbourne) and rising advertised stock levels that will provide more choice and less urgency for active buyers.
“We may see improving conditions in some cities where economic and demographic trends are improving and housing remains relatively affordable; Brisbane and Perth are good examples,” he says.
But North warns that “unless there’s a significant change in the economic environment in Australia, we’re going to see greater levels of mortgage defaults in the times ahead. Recent rate cuts have helped, but household income is experiencing little to no growth since 2011 and 2012”.
He adds: “My argument is that if people are being persuaded to come into the property market on the assumption that we’re going to see a lot of price growth, I think that’s a risk – we still have a very high household debt relative to any country in the world.”
Communicating the complexities
There is no question that the housing market is dynamic and multifaceted.
Lawless suggests that “like any asset class, tracking the performance of the housing market will range from macro-level assessments through to micro-level assessments, depending on the use case”.
For example, he says policymakers will be most interested in the macro view of the market to inform areas such as monetary policy, while small businesses and consumers will often be more interested in the specific trends in their local areas.
“CoreLogic research expands understanding of a ordability using up-to-date modelled household income data from the Australian National University,” he says. “This was previously a ‘black box’ in understanding housing a ordability because survey and census reporting on income data is relatively lagged. Modelled income data allows us to understand household income relative to housing costs on a biannual basis.” Agreeing, North says it is important to have a more holistic view of the housing market, one that includes an analysis of household income and expenditure.
He says, “A lot of the information that’s out there focuses on mortgages in isolation, a loan and product perspective, whereas I focus on a household perspective. I think that’s quite important.”
For these reasons, North suggests it would be good for brokers to work with households on a realistic set of budgets.
“So looking at cash flow in a lot of detail will be really important. Don’t lend as much as you can, sometimes less is more,” he says.
“Finally, it’s really important for people to go into this with their eyes open and say that it’s not necessarily the case that we’re going to see very strong growth ahead. Set people’s expectations realistically.”