
CoreLogic’s Home Value Index has shown an impressive growth of 8.9% over the past year, boosting the national median dwelling value by about $63,000 to $765,762 and reaching a new peak in February.
Kaytlin Ezzy (pictured above), economist from CoreLogic, attributed the rise to a mismatch between supply and demand.
“Despite three rate hikes, worsening affordability, and the rising cost of living, the increasingly entrenched undersupply in housing stock, and above-average demand thanks to strong net migration, has helped push values higher,” Ezzy said.
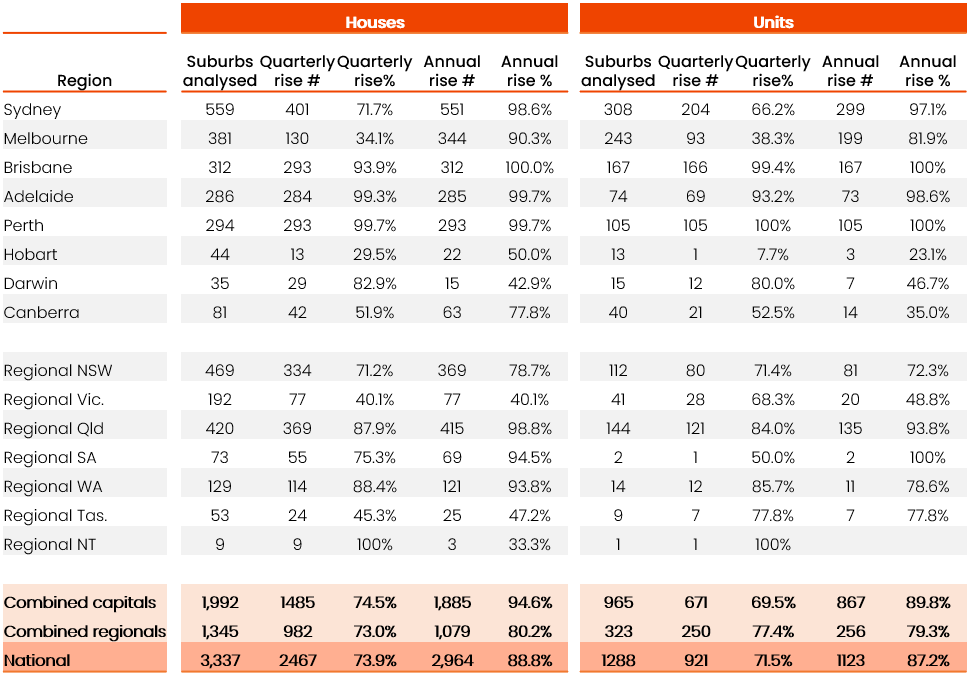
A detailed suburb-level analysis revealed that a majority, 88.4%, of the 4,625 house and unit markets saw value increases.
Brisbane, Adelaide, and Perth led the way with widespread value uplifts. Values in all 312 house and 167 unit markets analysed in Brisbane increased over the year. In contrast, East Perth, an inner-city suburb, was the sole market in the western capital to see a decrease in house values by -0.8%. In Adelaide, only one house market (Black Forest) and one unit market (Glenelg South) experienced declines, dropping -0.4% and -1.8% respectively by February.
“Not only have the annual increases in these cities been fairly broad-based, they’ve also been very strong, with the majority of suburbs recording double-digit value growth,” Ezzy said.
In Perth, 93.7% of markets saw more than 10% capital gains this year, with Waikiki units jumping 42.1%. Brisbane had 86.4% of its suburbs increase by over 10%, especially in the south and Logan-Beaudesert, while Adelaide saw three-quarters of its markets also grow significantly.
Quarterly, Perth’s Daglish dipped slightly, but Kwinana Town Centre and four unit areas surged above 10%. Adelaide's markets mostly advanced (99.3% for houses, 93.2% for units), whereas Brisbane’s central areas like Hamilton and Ascot experienced drops due to rising costs, CoreLogic reported.
Ezzy pointed out that Brisbane’s most affordable markets led quarterly growth, whereas Hobart faced declines in both quarterly and annual terms.
“The weakness in the Hobart market... has likely contributed to falling values over the past two years,” she said.
In Sydney and Melbourne, quarterly growth rates showed improvement following initial weaknesses post-November rate hike, with Sydney rising from 0.0% to 0.6% and Melbourne from -0.9% to -0.6% by February.
The uptick led to more suburbs experiencing value increases: in Sydney, from 55.1% to 69.8%, and in Melbourne, from 33.9% to 35.7%. Over the year, Sydney saw widespread value increases with only 2% of markets declining, while Melbourne had 87.0% of suburbs enjoying positive annual growth, indicating strong recovery in these cities.
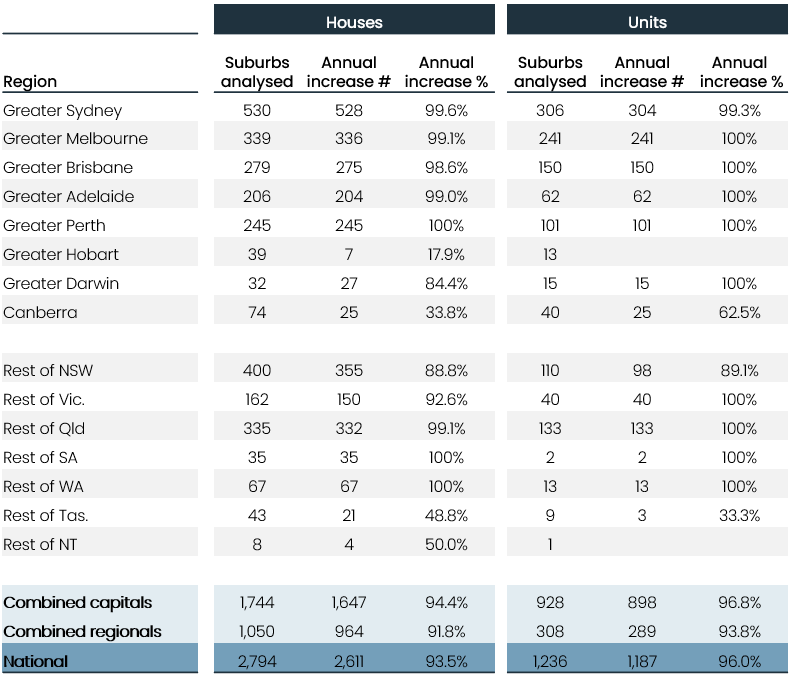
On the rental front, the analysis found a substantial rise in rental values, with 94.2% of the 4,030 house and unit markets experiencing an increase.
“Over the past few years, rental growth has been skewed to capital city units, but as unit rent affordability has been eroded, some prospective tenants may be shifting towards house rentals,” Ezzy said.
Perth topped annual rental growth among capitals, with all house and unit markets seeing increases and over 85% experiencing a rise of 10% or more. In contrast, Hobart saw limited rental growth, with only a few house markets up and all unit markets declining, with decreases between -1.4% to -5.6%, CoreLogic reported.
Get the hottest and freshest mortgage news delivered right into your inbox. Subscribe now to our FREE daily newsletter.