
Dwelling values in Australia have dropped by -8% over the past 12 months – the largest annual decline on record, according to CoreLogic’s Monthly Housing Chart Pack for April 2023.
Eliza Owen (pictured above), head of research at CoreLogic Australia, said after a consistent slowdown in the pace of decline across the combined capitals, values rose 0.8% in the month of March – marking the first increase in capital city home values since April 2022.
Residential real estate in Australia had a total value of $9.4 trillion at the end of March, up from $9.3 trillion the previous month but well below the peak of $10 trillion in April.
Regional South Australia delivered the highest annual growth rate in dwelling values across the regional and capital city dwelling markets, with values lifting 11.3% in the past year, while the lowest change in home values was across Hobart, where home values fell -12.9% in the last 12 months, followed by Sydney, with a -12.1% decline in values.
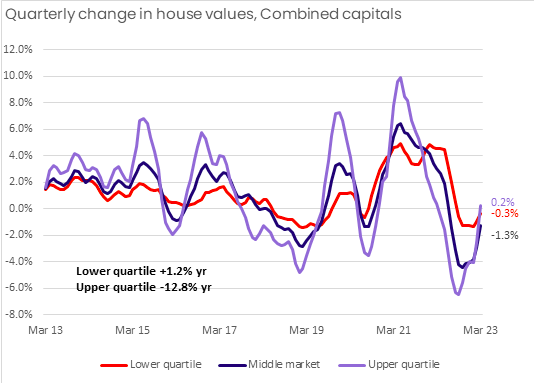
The chart of the month also showed an improvement in capital growth trends across the top 25% of home values. (See graph below).
Sales volumes trended slightly higher through March to an estimate of 44,124 in the month. Year-on-year, sales are down -20.7%, CoreLogic reported.
Properties were taking longer to sell across Australia. In the three months to March, the median days on market in capital cities were 34, 50 days in regional Australia, and 40 days nationally.
Median vendor discounting nationally has deepened in the three months to March to -4.2%. That’s an increase compared with -3.1% in the March quarter of 2022. Capital city discounting rates, on the other hand, have eased through 2023 to date.
The housing chart pack also showed that the volume of new listings totalled 36,464 nationally in the four weeks to April 2. After having moved through a seasonal peak, new listings were likely to trend lower through the cooler months of the year before rising in spring. Meanwhile, total listings numbered 145,196, which was -25.2% lower than the five-year average.
In the four weeks ending April 2, the combined capital cities clearance rate averaged 65.4%. And while this was a much stronger result compared to the average 55.1% in the final weeks of 2022, auction volumes did drop slightly from the previous four-week period (65.8%).
Annual growth in rent values remained steady from the previous month in March, at 10.1%. Australian rent values increased by a record 10.2% annually in the 12 months to December, with unit rents across Sydney, Melbourne, and Brisbane seeing the most rapid rise, of around 14% to 17% annually.
Use the comment section below to tell us how you felt about this story.