
Australian home values increased 2.9% in the three months to July, the highest quarterly movement since January, but monthly growth eased from 1.1% in June to 0.7%.
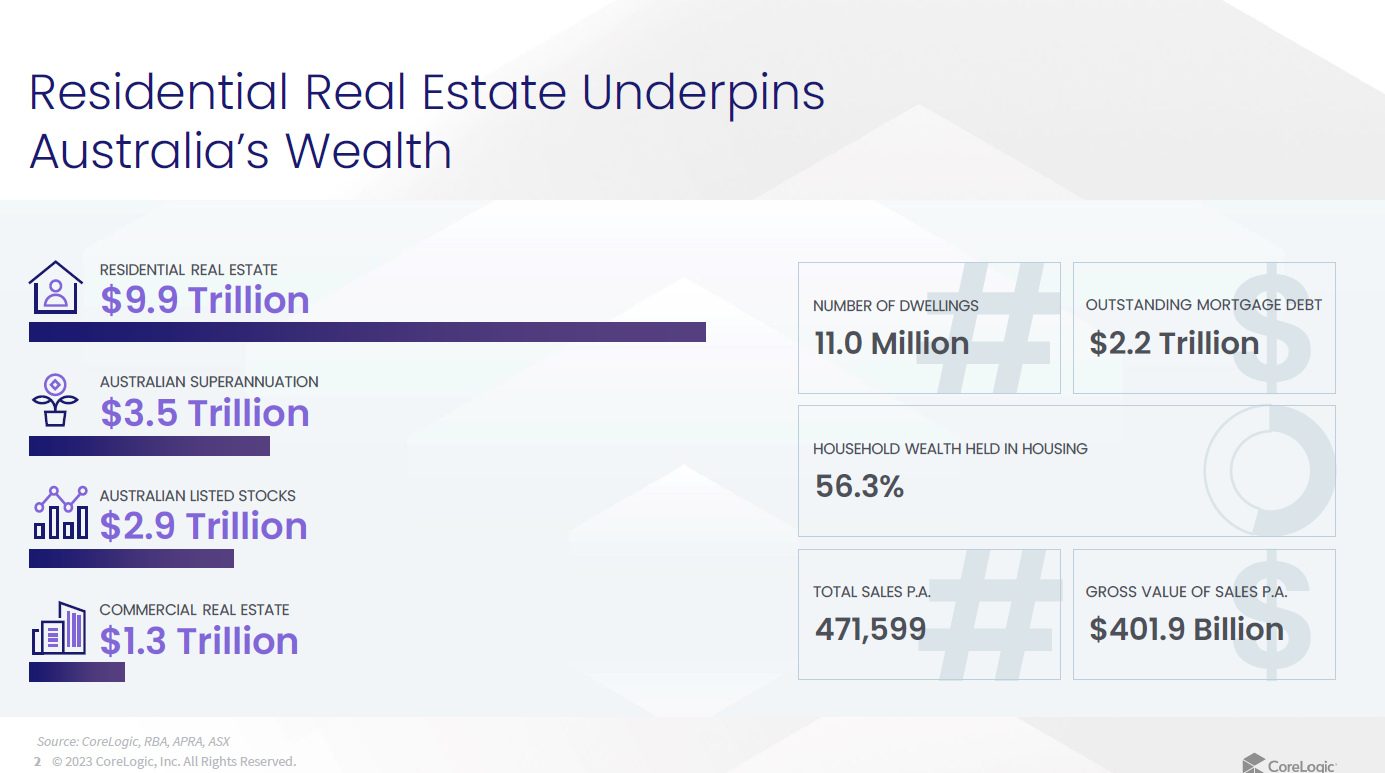
This was according to CoreLogic’s latest Monthly Chart Pack, which also estimated the combined value of real estate in Australia to be at $9.9 trillion at the end of July.
“The combined capital cities dwelling market value rose 0.8% in July, easing from a 1.2% lift in June,” said Eliza Owen (pictured above), head of research at CoreLogic Australia. “Monthly increases across the combined capitals surpassed a 0.2% lift in the combined regional market over the month.”
Sales volumes appeared to be stabilising based on the six-month moving trend and despite being down from recent highs in 2021. It numbered 39,064 nationally in July, compared to a historic five-year average of 40,120 in the month of July.
The median days on the market trended slightly higher through the three months to July, with properties now taking 34 days to sell, up from a recent low of 30 days in the three months to April.
Vendors were now offering less discount on their property at the median level. The median vendor discount nationally climbed to -3.9% in the three months to July, from a recent low of -4.4% at the end of last year.
New listings totalled 33,616 across Australia in the four weeks to July 30.
“New listings trended slightly higher through July, which is unusual for this time of year. However, new listings remain slightly lower than the historic five-year average,” Owen said. “At the national level, there were 132,058 listings observed over the four weeks to July 30. Total listings are trending lower than the previous five-year average due to strong absorption from sales.”
Clearance rates across the combined capital cities eased slightly through the month. In the four weeks ending July 30, they averaged 66.5%, lower than a recent high in the average final clearance rate of 71.3% in the four weeks to June 4. While the capital city clearance rate was falling, it continued to trend above the decade average of 65.1%.
Australian rent values rose another 0.6% in July, taking the national annual rise to 9.4%. Annual growth in rent values remained high on the previous decade average but has shown signs of slowing down. Rent growth tumbled from a 10.2% high over the 2022 calendar year.
Against the 0.6% monthly rise in rent values nationally, purchase values lifted 0.7%, creating a marginal reduction in the national gross rent yield to 3.83%, from 3.84% in the previous month.
ABS data showed dwelling approvals dropped -7.7% in June, consisting of a -0.8% decline across detached houses and a -16.2% dip in unit approvals. For the past 12 months, monthly dwelling approvals have averaged 14,649 per month, below a decade monthly average of 17,344.
CoreLogic said the August Chart of the Month compared historic periods of rental market upswings nationally, revealing that the current 35-month stretch of consecutive increases was the longest growth period since 2009-2013.
Use the comment section below to tell us how you felt about this.