
The Australian housing market has seen an increasing flow of new listings since mid-June, in contrast to the usual seasonal trend where new vendor activity would be trending lower through the colder months, CoreLogic data showed.
Through this year’s winter season so far, new listings have increased by 13.2%, driven mostly by a 17.9% rise across the capital cities compared with a 4.6% rise in the flow of new listings across the combined regional areas of the country. This was in contrast to the pre-COVID decade average of a 5.2% drop in new listings before rising by an average 9.8% between winter and spring.
Over the four weeks ending Aug. 13, new listings added to the Australian housing market was up 3.3% compared to the previous five-year average – the first time the flow of new listings rose above the five-year benchmark since September last year.
“The counter seasonal lift in vendor activity can probably be attributed to the positive turn in housing values across most regions since March alongside historically low advertised supply levels working to boost vendor confidence. As noted by CoreLogic in May, there is a positive correlation between rising housing values and a lift in new listings,” said Tim Lawless (pictured above), executive research director of CoreLogic’s Asia-Pacific research division.
“Anecdotally, we may also be seeing more homeowners needing to sell amid a peak in the ‘fixed rate cliff,’ elevated interest rates and high cost of living pressures. Data on mortgage arrears continues to show a historically small portion of borrowers are behind on their mortgage repayments, however we are likely to see mortgage stress becoming more evident through the second half of the year.”
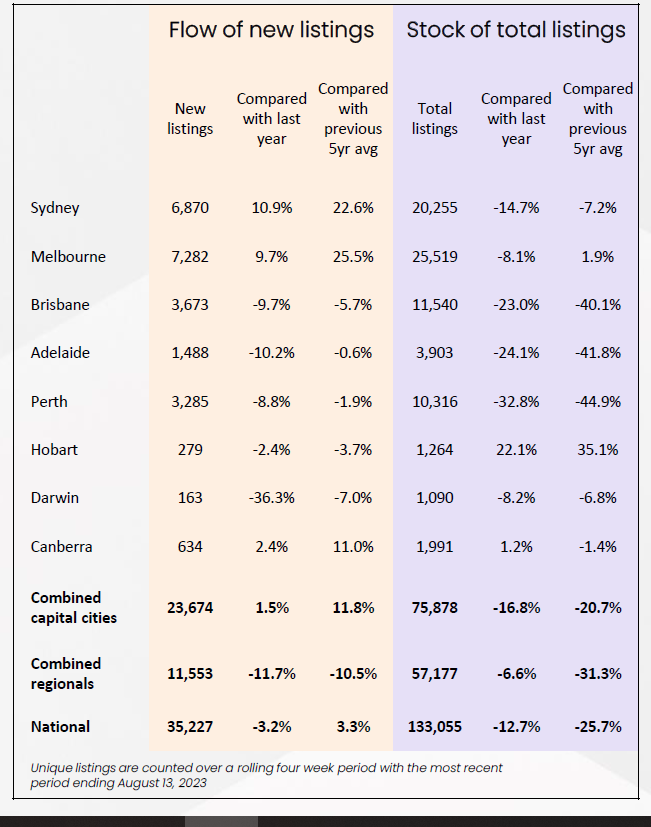
While most of the broad regions of Australia saw an increase in the flow of fresh listings into the market, the lift was generally from a low base and driven by the capital cities. New listings were up 1.5% in the combined capitals compared to the same period a year ago but were down 11.7% across the combined regional markets.
Across the capitals, Sydney (+10.9%), Melbourne (+9.7%), and the ACT (+2.4%) were the only cities to record a higher number of new listings relative to the prior year, with each of these cities now recording a new listing trend that is above the previous five-year average as well.
The rest of the capitals, meanwhile, posted an increase in the number of new listings through winter, but not enough to push fresh stock levels higher than the previous year ago or above the previous five-year benchmark.
Regional listing trends haven’t shown the same uplift. Since winter began, the trend in new listings rose 4.6% across the combined regional areas of Australia but was still down 11.7% from the levels recorded in 2022 and down 10.5% compared to the previous five-year average.
“Regional Victoria is the only broad rest-of-state region to record a higher number of fresh listings relative to a year ago, but only marginally at 0.9%,” Lawless said. “Similarly, regional Victoria is the only regional market where new listings are above the previous five-year benchmark (+4.2%).”
Despite the increase in the fresh flow of new listings across most regions, total advertised supply generally remained tight. Since the start of winter, total advertised supply has decreased by 3.5% despite a 13.2% lift in the flow of new listings.
“However, more recently as the flow of new listings gathers some pace, demand hasn’t quite kept pace,” Lawless said. “The past four weeks has seen advertised stock levels edging 0.3% higher, led by a 2.2% rise in total listings across the capitals and offset by a 2.2% fall across the combined regional areas.”
The month-on-month increase in total advertised levels was led by Sydney, which was up 5.3% over the four weeks ending Aug. 13. This was followed by Melbourne (+4.4%) and Canberra (+4.3%). Only Hobart (+22.1%) and Canberra (+1.2%) were the capital cities that posted total advertised stock levels that were higher than at the same period last year. Listings were now higher in Melbourne (+1.9%) and Hobart (+35.1%), compared with the previous five-year average.
At the other end of the spectrum was Perth, where total listing numbers were trending lower alongside a relatively flat trend in new listings and above-average purchasing activity. Advertised stock across Perth was now down 44.9% compared to the previous five-year average. Adelaide (-41.8%) and Brisbane (-40.1%), too, were showing extremely tight levels of available supply relative to the previous five-year average.
In cities where advertised supply levels have risen, the pace of value growth has slowed down. Sydney home values lifted 1.8% month-on-month in May, halving to 0.9% by the end of July, and easing further in August, according to CoreLogic data. Melbourne’s pace of value growth has slowed down from 0.9% in May to 0.3% in July while home values edged 0.1% lower across the ACT in July.
Cities with tight supply levels have experienced an acceleration in value growth, with CoreLogic’s daily index showing a 1.2% lift in Perth values over the past four weeks, a 1.4% increase in Brisbane values and a 1.5% rise across Adelaide.
“Considering advertised supply levels are now starting to rise in some cities, selling conditions in these areas are likely to become more competitive through spring,” Lawless said.
“More choice and less urgency is a positive outcome for buyers, but it could see an easing in auction clearance rates and longer selling times unless we see a commensurate lift in buyer demand alongside higher advertised supply levels.
“With consumer sentiment holding around the same lows as the global financial crisis and early phase of the pandemic, and credit conditions remaining tight, it’s hard to see a material lift in purchasing activity ahead.”
Use the comment section below to tell us how you felt about this.