
Australia’s capital city housing markets are now moving more in sync than they have in years, according to Cotality’s latest Housing Chart Pack for June.
After diverging widely during the pandemic and recovery period, growth rates across the capitals have tightened to the narrowest range since March 2021.
In May, the difference between the strongest and weakest annual dwelling value growth was just 9.8 percentage points – compared with a 26.1-point spread as recently as August 2024.
Cotality research director Tim Lawless (pictured) said this convergence reflects cooling conditions in stronger markets and early signs of recovery in those that previously lagged.
“The convergence of growth rates is attributable to the pace of capital gains slowing across the mid-sized capitals while previously soft markets like Melbourne, ACT and Hobart move back into a positive growth position,” Lawless said.
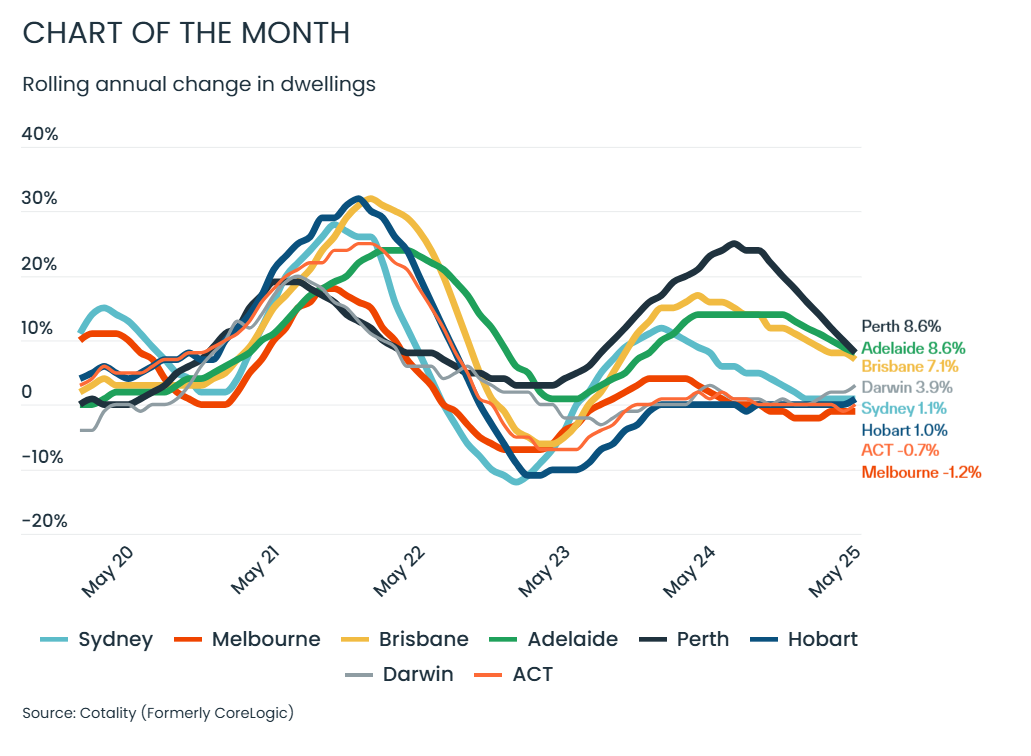
“Growth across Perth, Adelaide, and Brisbane have slowed amid worsening affordability constraints, reduced interstate migration, and a drop in investment demand. Although, despite the slowdown, Perth and Adelaide continue to post the strongest annual gains at 8.6%, though well below their cyclical peaks of over 25%.”
Meanwhile, lower interest rates and improved affordability are helping lift values in cities that had seen the deepest downturns.
“For Sydney, home values have bounced back from a 12.4% decline in early 2023 to positive growth by July 2023, peaking at 12.3% annual growth in January 2024, but since then, growth has slowed to its lowest rate (1.1%) since June 2023,” Lawless said.
“Melbourne’s annual rate of decline has eased from -7.8% in January 2023 to -1.2% over the past year, with values steadily increasing since February.
“Hobart’s rate of decline has turned positive, with values up 1% over the past 12 months following a peak rate of annual decline of -11.8% in March 2023.”
He said capital city housing markets were now moving more in step than they had in years.
Beyond the annual figures, Cotality’s data showed Darwin leading the pack in quarterly growth, with a 4.3% lift in dwelling values over the three months to May. Perth and Brisbane followed, each posting a 1.6% rise.
In regional markets, Western Australia and South Australia remained strong performers. Regional WA posted a 12.5% annual rise, with regional SA close behind at 12.4%.
The rolling quarterly trend for national dwelling values held steady at 1.3% through May, matching April’s revised figure. However, annual growth continued to ease, slowing to 3.3% – the lowest annual increase since August 2023.
Market activity indicators showed mixed trends. Nationally, 35,069 properties were newly listed for sale over the four weeks to June 1, reflecting a rebound in vendor activity.
However, the median time on market rose to 34 days in the three months to May, up from 30 days previously.
Sales activity remained robust, with an estimated 43,903 sales in May, bringing the rolling 12-month count to 526,530.
The median vendor discounting rate eased to 3.4% in May, down from a recent peak of 3.7% in January.
On the rental front, national dwelling rents increased 0.4% in May, continuing a trend of slower growth after sharp rises earlier in the cycle.
Cotality estimates the combined value of residential real estate rose to $11.4 trillion at the end of May.
This aligns with ABS data showing the total value of Australia’s dwellings rose by $130.7 billion in the March quarter, pushing the national average price past $1 million for the first time. Western Australia, South Australia, and Queensland were the main contributors, while annual growth slowed to 5.9% from 9.5% a year earlier.