
Australia’s residential property market recorded a strong surge in listings in May, with total listings rising 5.9% month-on-month to 256,628, according to SQM Research.
Compared to a year ago, this represents a 1.5% increase.
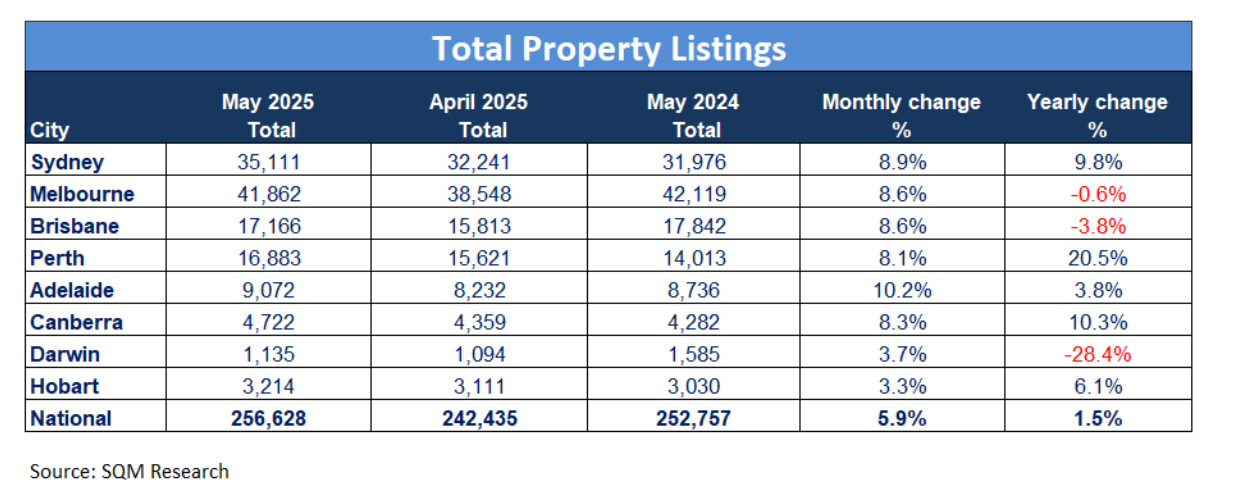
Sydney and Melbourne led the rise in dwellings for sale. Sydney listings climbed 8.9% for the month and 9.8% year-on-year, while Melbourne rose 8.6% but remains 0.6% lower than a year earlier. Brisbane and Perth also posted monthly gains of 8.6% and 8.1%, with Perth up 20.5% annually.
Adelaide (10.2%), Canberra (8.3%), Hobart (3.3%), and Darwin (3.7%) followed, though Darwin continues to lead yearly declines with a 28.4% drop.
National new property listings (homes listed for less than 30 days) rose 4.2% in May to 69,021, reversing some of April’s softness. However, new listings remain 8.2% lower year-on-year, SQM Research data showed.
Sydney and Canberra recorded the biggest monthly jumps at 17.9% and 16.2%, followed by Melbourne (14.1%) and Brisbane (10.7%). Hobart was the only capital to post a monthly decline, with new listings falling 20%.
Older property listings (on the market for over 180 days) climbed 8.8% nationally to 82,786, up 13.5% compared to May 2024.
Melbourne’s and Sydney’s older stock rose 6.2% and 5.7% respectively, with annual growth in those cities at 15.8% and 29.5%. Canberra stood out with a 10.1% monthly jump and a staggering 58.8% annual rise.
In contrast, Darwin recorded a monthly drop of 2.1% and a sharp 46.2% fall year-on-year.
Distressed residential listings dropped 4.2% to 4,593 in April 2025, 9.9% lower than a year ago. WA (-9.6%) and QLD (-5.5%) led the monthly declines, while Victoria was down 5.1% but up 8.1% annually. ACT was the only state with a large increase, up 36% month-on-month and 13.3% year-on-year.
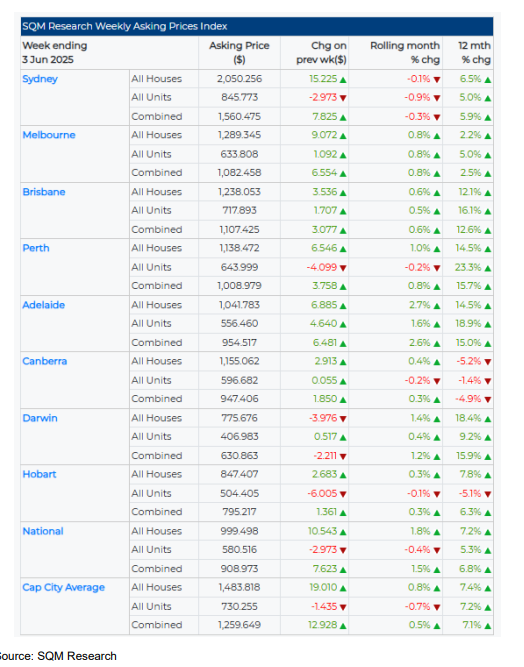
The asking price landscape shows a patchwork of trends across capital cities:
Nationally, houses are up 7.2% and units 5.3% year-on-year.
“As expected, we saw a large lift in listings following the federal election. The bounce in new listings indicates renewed confidence,” said Louis Christopher (pictured), managing director of SQM Research.
“Yet older stock continues to accumulate in cities like Sydney and Melbourne, suggesting that many vendor pricing expectations may still be out of step with the market.
“The further drop in distressed listings nationally is a positive indicator, pointing to a still-benign environment despite the elevated interest rates environment from 2022 to 2025.
“The recent cuts in interest rates followed by another highly probable rate cut in July should continue to see only moderate levels of distressed selling activity.”